Navigating the Possible Futures of the Colorado River
A new scientific framework can help navigate drought concerns in the Colorado River and beyond, illuminating options for decision-makers who are grappling with future planning.
By: Antonia Hadjimichael, Mikaela Corney, Palak Mattoo, Travis Thurber
Based on the study by: Antonia Hadjimichael, Patrick M. Reed, Julianne D. Quinn, Chris R. Vernon,
& Travis Thurber originally published April 10, 2024
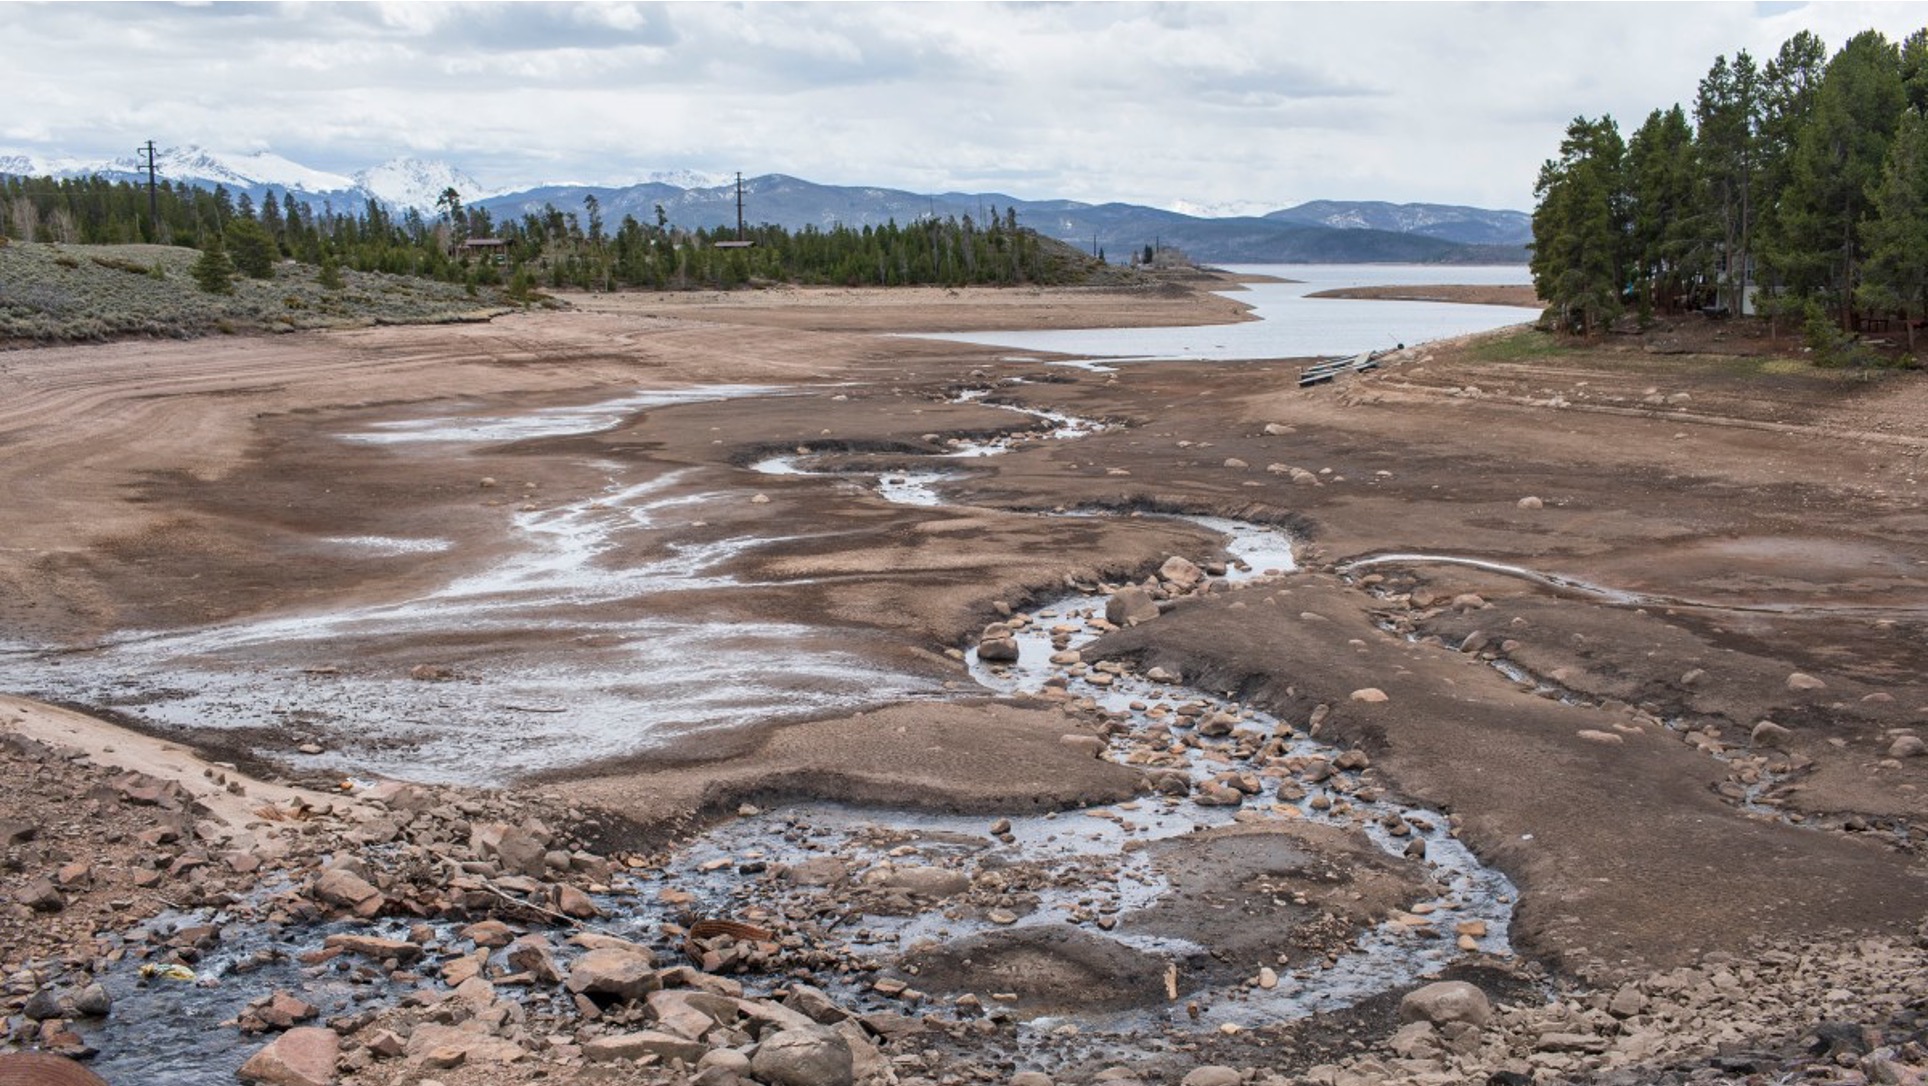
The Colorado River is one of the most essential water sources in the southwestern United States. Stretching approximately 1,450 miles (2,330 kilometers), its headwaters are in the Rocky Mountains of Colorado and the river eventually ends at the Gulf of California in Mexico.
The Colorado River and its tributaries sustain 40 million people as well as diverse ecosystems, including endangered species.
As water levels dwindle, the survival of numerous towns and ecosystems hangs in the balance. Scientists and policymakers grapple with the challenge of understanding what future droughts might look like for the region and preparing for their profound impacts on both human and natural systems.
A New Framework for 21st Century Challenges
Rather than attempting to predict the future and forecast specific outcomes, exploratory
modeling approaches investigate how a system might respond under a large number of “states of
the world”, i.e., hypothesized plausible future conditions we might encounter.
Preparing for the Future

In this approach a small set of potential futures is selected to span a range of possible changes (or scenarios). The scenarios often describe expected “best-” and “worst-case” conditions, and in the climate context, they might be tied to global emissions scenarios. Actions are then determined for each of the few scenarios, implicitly assuming they describe all possible outcomes.

This approach develops a larger and more complete set of plausible futures than is possible with a handful of scenarios. These “states of the world” represent a wider range future conditions. Different classification algorithms can then be used to discover which states result in critical outcomes and whether any action should take place.

This approach recognizes that we often care about how we reach one particular outcome, not only the outcome itself. This new framework allows us to group or classify states of the world based on their trajectories. This allows us to provide additional context to the outcomes and create scenario storylines that describe how the outcomes came to be.
We introduce a framework called FRNSIC (FRamework for Narrative Storylines and Impact Classification). This is a new approach that builds on exploratory modeling techniques to not only identify consequential outcomes from different stakeholder perspectives (e.g., severe water shortages) but also identify and classify the consequential dynamics that cause them. We combine the classification of consequential dynamics and outcomes to discover scenario storylines.
These scenario storylines:
- Arise from a broader universe of potential futures that capture a lot more possible future conditions than traditional scenario planning,
- Provide a better understanding of the types of adaptation decisions that could be beneficial and to whom.
FRNSIC was recently published in the journal Earth’s Future . Below, we demonstrate its application.
FRamework for Narrative Storylines and Impact Classification (FRNSIC)

![Image [object Object]](./img/Map1.svg)
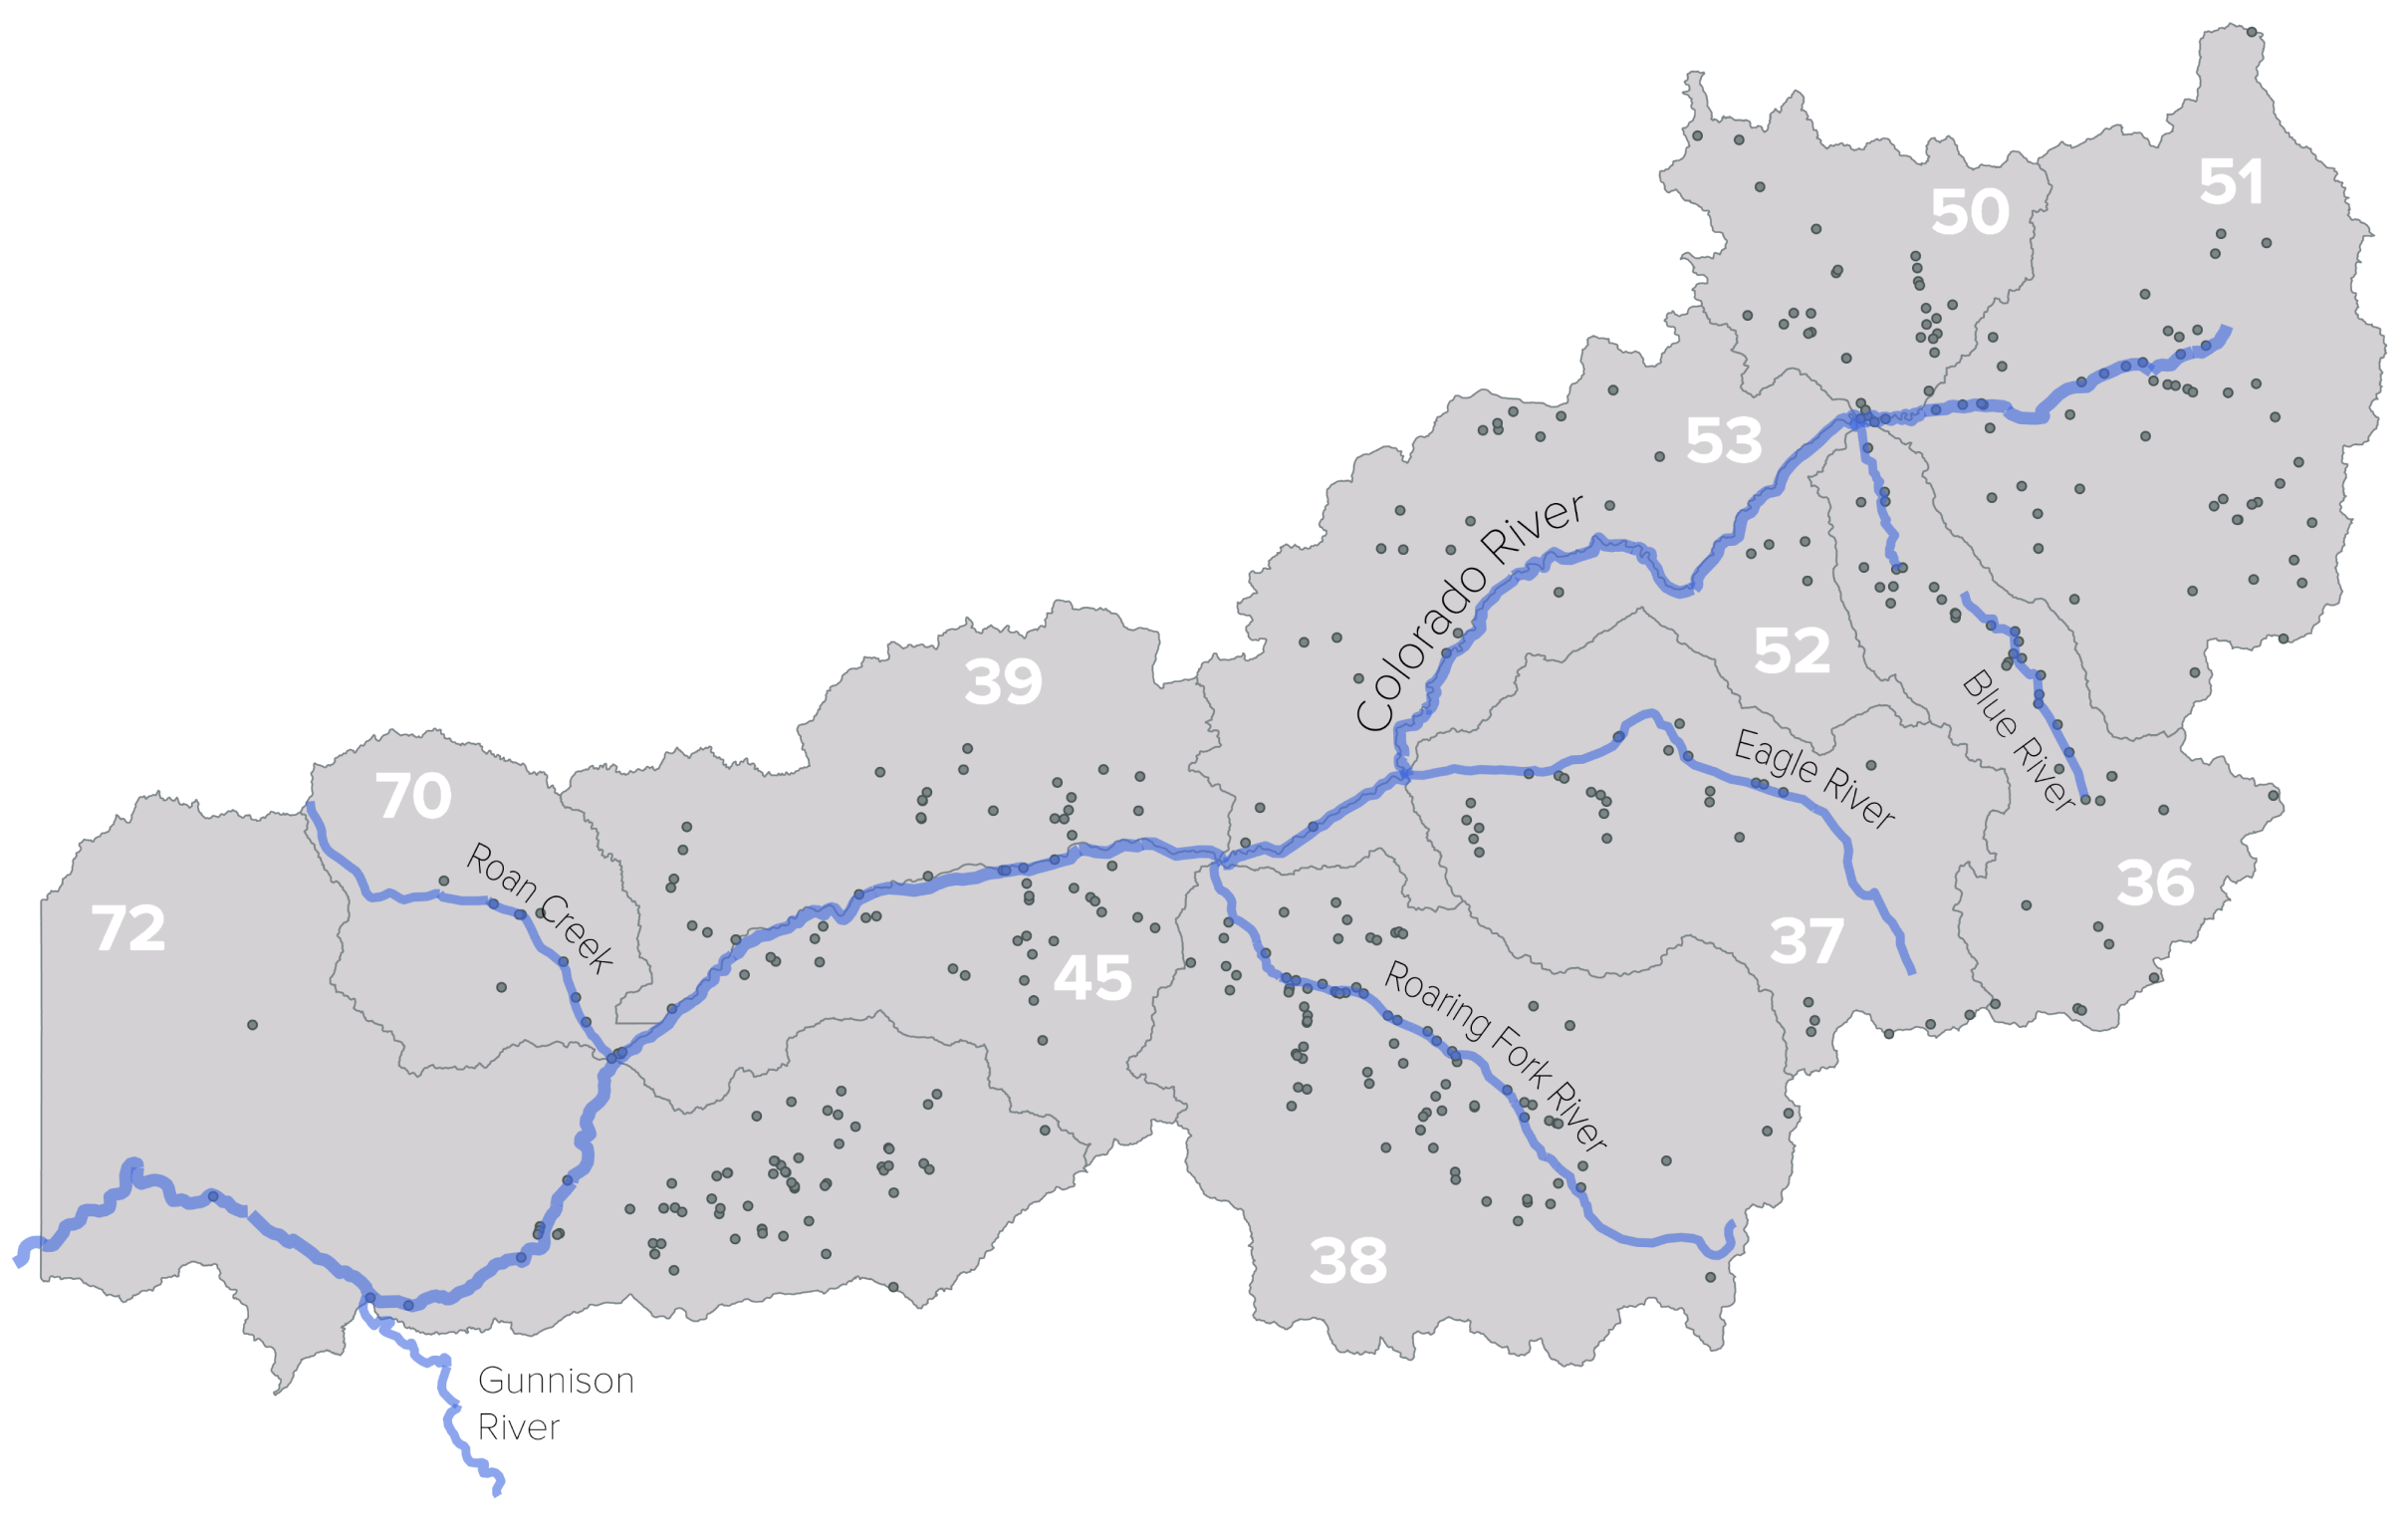
To demonstrate its capabilities, we apply FRNSIC in a watershed located in the headwaters of the Colorado River, the Upper Colorado River Basin within the state of Colorado.
The Upper Colorado River Basin begins at the Continental Divide and moves into Utah to deliver water to Lake Powell. As with all western basins in the state, it is bound by the Colorado River Compact, which means that sufficient water deliveries have to be made downstream, to meet obligations to other states.When local decision makers prepare for the future, they often need to understand how future water supplies might change, and how they might affect their ability to meet their obligations, while maintaining deliveries to local users.
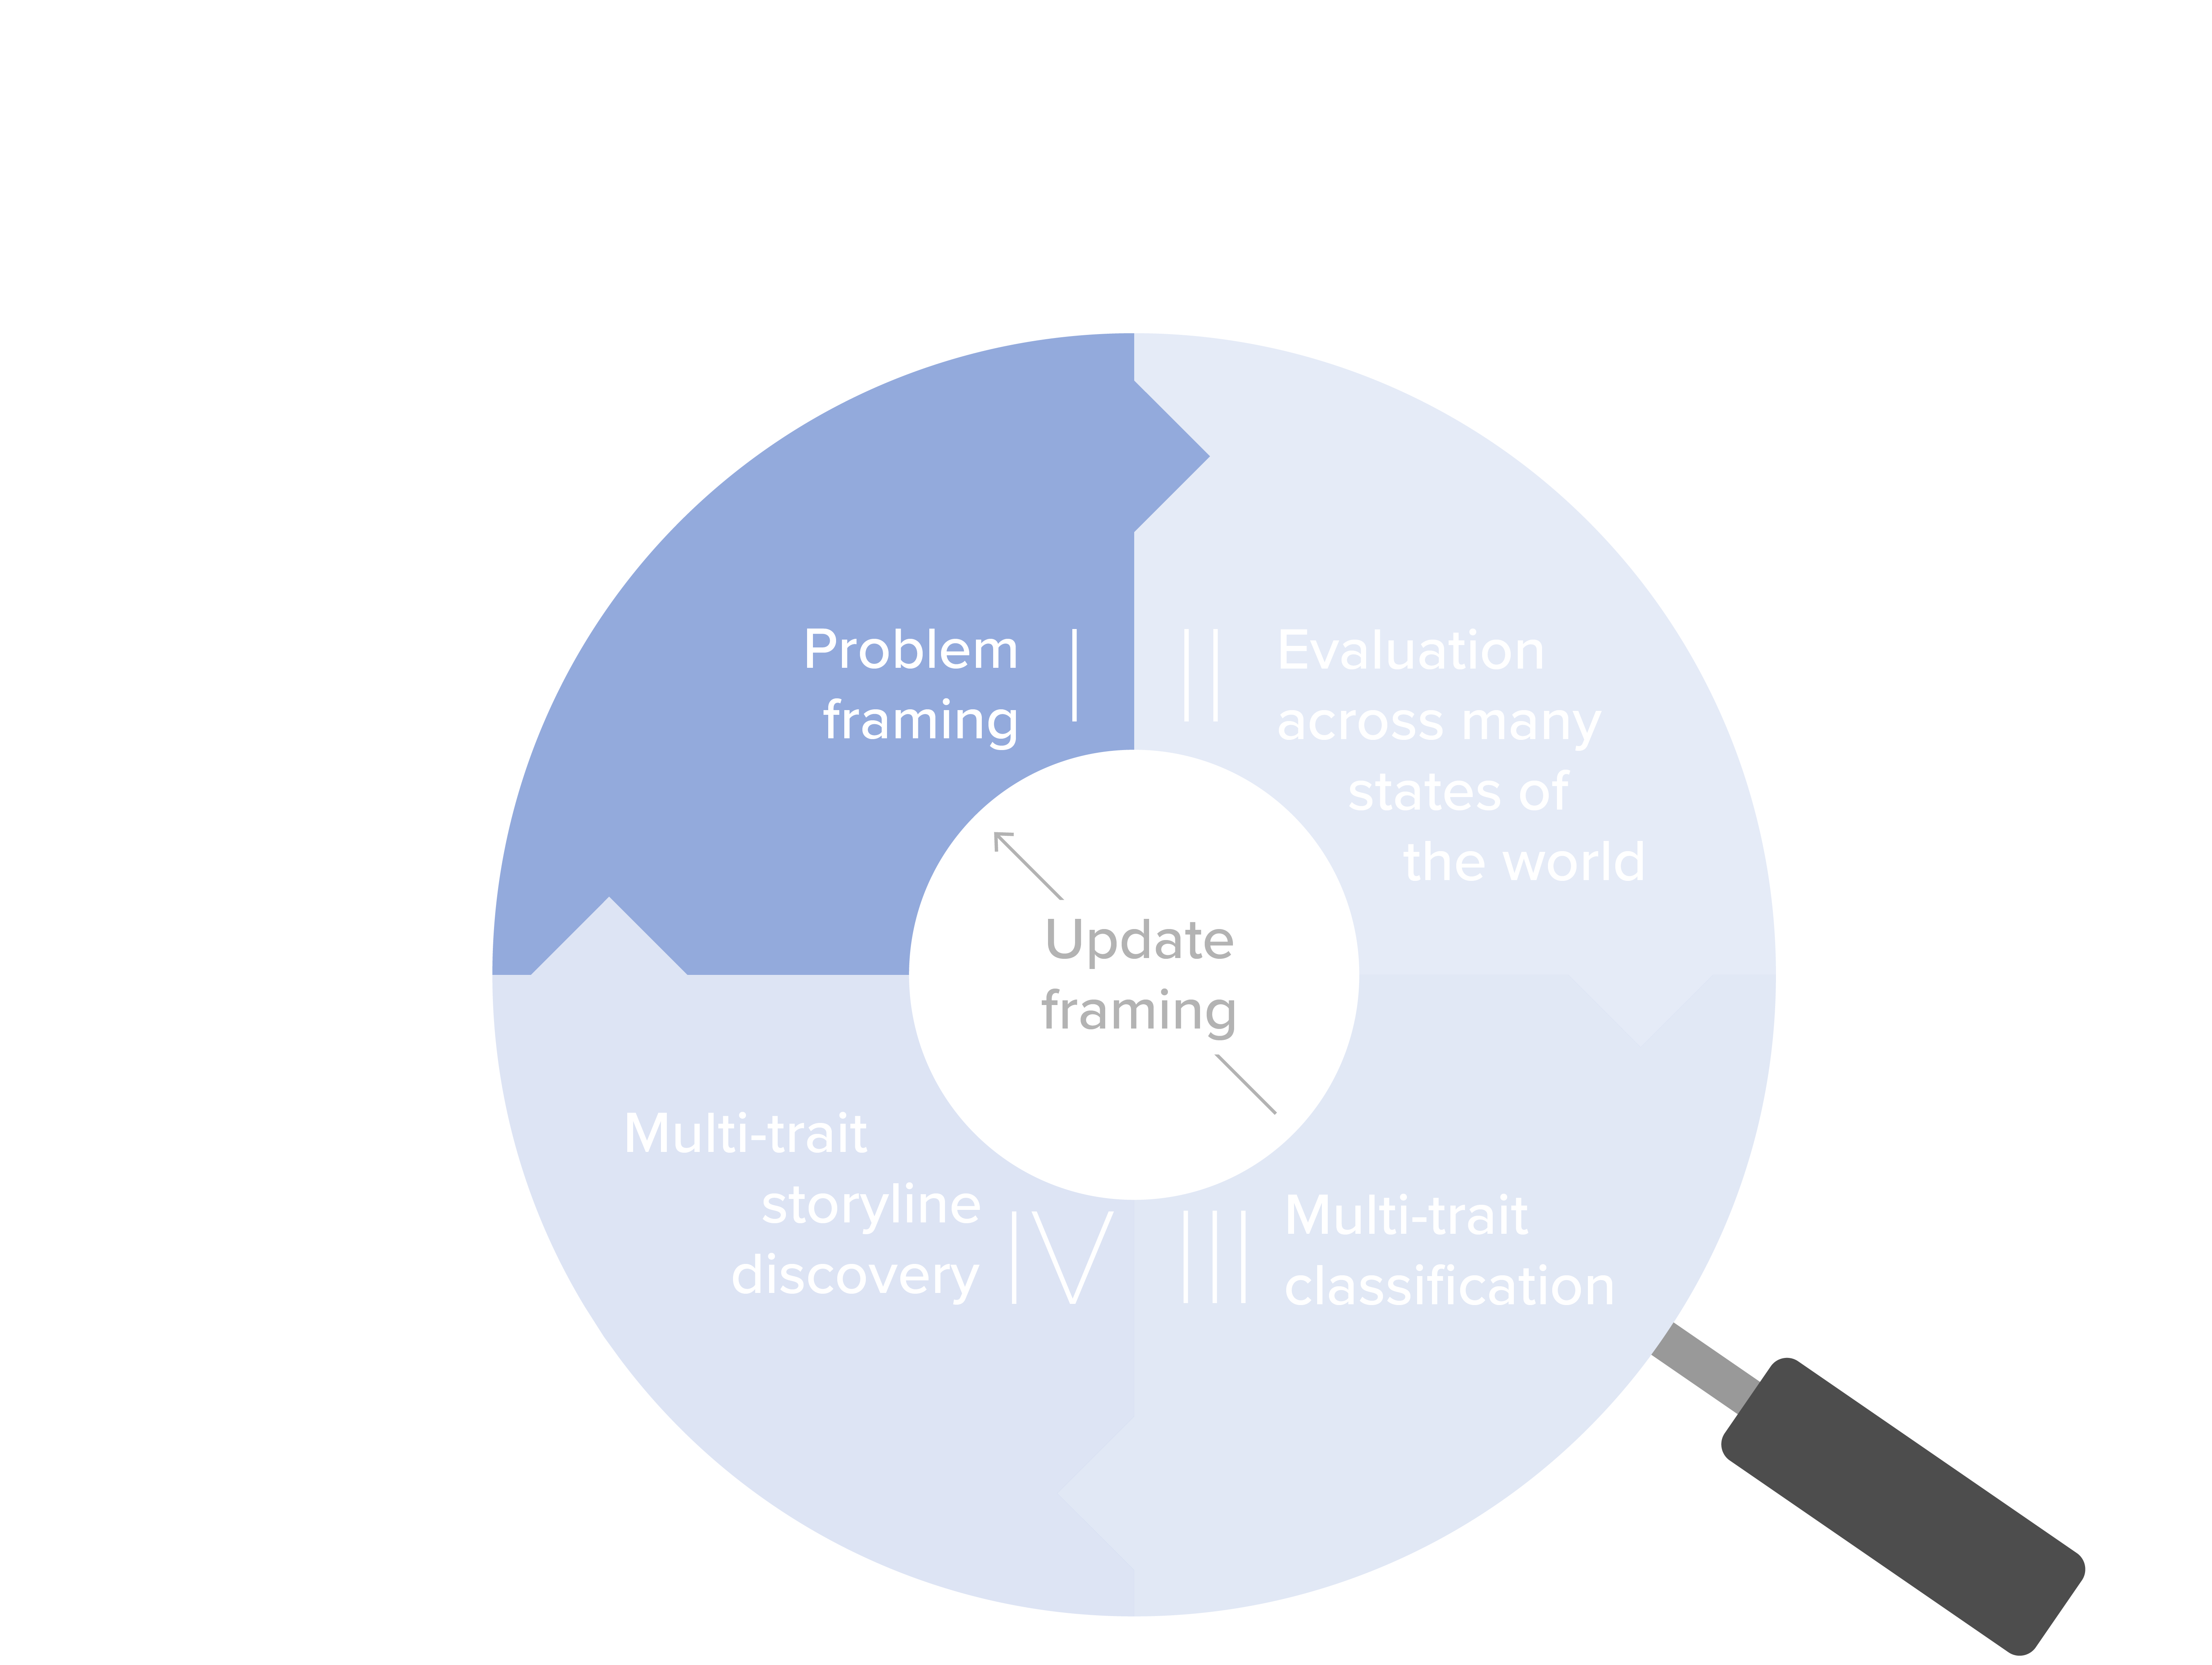
Stage I: Problem Framing
Analysts and stakeholders define the key elements of the analysis:
- • metrics that quantify how well we are achieving our goals for a system
- • actions that can be taken
- • uncertainties that may affect how we achieve system goals
- • relationships between metrics, actions and uncertainties (which often take the form of simulation models)
When applying FRNSIC to the Upper Colorado River Basin, planners might want to consider how future drought conditions will impact their stakeholders. Deliveries in this basin need to be balanced between downstream obligations and local needs for water, especially agriculture, which is one of Colorado’s major industries. We will be classifying impacts to these users in Stage III.
Because water is allocated based on water rights ownership, droughts are experienced differently depending on one’s right seniority and location on the river. This means that a small number of future scenarios might not capture impactful consequences for all the diverse users.
Stage II: Evaluation across many states of the world
Here, analysts use exploratory modeling to assess the system under a large number of plausible future conditions, as well as various actions or policies. This is typically achieved by creating ensembles of model simulations, each representing combinations of assumptions about the future.
For the Upper Colorado River Basin, this means creating a broad range of plausible drought futures. We design this ensemble to represent changes in the distribution of wet and dry stream conditions, as informed by observations, reconstructions of paleoclimatic data, and climate change projections for the region.
Stage III: Multi-trait classificationIn this stage, we group different scenarios based on their dynamic traits and the impacts they have. This involves looking at states of the world with specific dynamic traits (like variability or specific patterns) and also the outcomes they produce (such as whether they meet certain goals). As a result, they create two sets of categories: one to describe changes in the traits for how the system will evolve (dynamics) and another to classify important outcomes (impacts).
For the dynamics in the Upper Colorado River Basin, we are focusing on states of the world that exhibit changes in the distribution of dry conditions (average and variability), as well as states that exhibit changes in decadal drought occurrence. These are selected based on prior work in the region that has identified these traits as key drivers of water scarcity impacts. In terms of impacts, we’re focusing on how these dynamics:
- • change water shortages in the basin,
- • increase the number of water users affected by shortage, and
- • jeopardize the basin’s ability to deliver downstream.
Applying FRNSIC Stage III - Classification of Dynamic Traits
The classification of both dynamic traits and impacts is the key contribution of FRNSIC and enables the discovery of scenario storylines. The example below demonstrates how dynamic traits can be classified using simple set theory.
![Image [object Object]](./img/frnsic_st3_1.svg)
Create sets of changing dynamic traits
In the Upper Colorado River Basin example, we use three dynamic traits to classify the potential states of the world:
- • the average of dry flows (flow of a water in a stream during periods of low or no precipitation)
- • the variability of dry flows
- • the occurrence of decadal droughts
For every state of the world in the ensemble, we check whether these traits are changing, as compared to observed history. We then create sets containing these changing states of the world, as well as three overlapping sets ( ) that describe combinations of changes.
Use combination sets to visualize effects
To allow for direct comparison between the outcomes of the three combinations of traits, we visualize them in a circle, where each segment represents a set of states of the world where two dynamic traits are changing.
Use combination sets to visualize effectsThis visualization is inspired by stacked hive plots, where each of the three segments represents the number of states of the word that meet the two dynamic conditions. The bigger the piece, the more possible states of the world exhibit those traits.In this particular example, there are more states of the world that exhibit a changing average and variability of dry flow conditions (green) than those exhibiting changing variability and drought occurrence (purple).
Classification of Impacts
Given the different stakeholder concerns —like ensuring water for local users and downstream states—there is a need to categorize how these explored states of the world impact certain important categories. So, FRNSIC uses a hierarchical impact set classification, combined with a hierarchical color scheme, to classify different combinations of impacts.
The example below looks at the questions ‘are there overall water shortages more than 10%?' and 'are more than 50% of water users affected?’. These metrics and thresholds are used here for demonstration, but are selected based on historical impacts in the basin. Other stakeholder-relevant impact metrics can also be used. Color is then used to create a hue indicating possible answers. When a state of the world creates significant shortages, it is given a blue color; when it affects a large number of users, it is given a pink color; and when it does both, it is given a purple color. We also track whether the states of the world result in reduced downstream deliveries to Lake Powell, and we indicate those with darker colors.
Are average water shortages mores than 10%?
Are more than 50% of users affected?
Are downstream deliveries lower than the historical worst decade?
Combining the Impacts and Dynamic Properties
The final step is to combine the dynamic traits (variability, average and droughts) with the color scheme describing impacts. The result is a visualization of the high-dimensional dataset in a single figure.

The three segments of the circle each correspond to the overlapping sets of average,
variability and drought occurrence. The radius of each segment (how much it extends from the
center point) shows how many states of the world (SOWs) are included in the overlapping set.
The color of each band indicates the impacts generated.
Similar to the size of each segment, the width of each band indicates the number of states of the
world that result in a particular impact category. Wider bands indicate that more states produced
impacts in that impact category.
We also place the most severe impact categories in the center and move outward in order
of diminishing severity.
Applying FRNSIC Stage IV - Examining Scenario Storylines
This figure is then used to describe scenario storylines that outline plausible future impacts and the conditions that can generate them. These storylines offer valuable insights into the conditions and help guide decision-making for the future. In the context of the Upper Colorado River Basin, selecting a scenario storyline involves evaluating its relevance to the specific challenges and priorities facing decision-makers. By examining how each scenario manifests at the local scale, decision-makers can gain new insights into the potential implications for water management and planning strategies.
Let’s examine one of these scenario storylines to see how it applies at the basin scale:
![Image [object Object]](./img/impacts_hive.png)
When preparing for the future, planners might want to consider how plausible future impacts are generated, i.e., what system dynamics to monitor for as a driver for these effects. In exploratory modeling, this is often referred to as scenario discovery.
When applying FRNSIC, scenario discovery happens by examining the different bands exhibiting different dynamics and impacts combinations.
The center holds the states of the world that generate the most severe impacts.
We further examine a storyline that exhibits changing a changing dry flow average and variability and produces impacts in all three categories.
We compare how the basin’s deliveries downstream and how basin-wide water shortages relate to the historical worst years. In this storyline, a drought spanning 20 years takes place (shown by the vertical grey lines) and severely increases both types of impacts.
Looking at the deliveries the basin is able to make downstream, they fall significantly below the basin’s 10th percentile of deliveries (i.e., the worst 10%).
At the same time, basin-wide water shortages accumulate to over 5 times the historical 90th percentile (i.e., the historical worst 10%).
We can also examine the implications of this storyline in more depth, by zooming in to impacts for individual users and water districts. In the Upper Colorado River Basin, this is enabled through the use of an open-source model developed by the state, StateMod, that quantifies water supplies to individual water users.
What we see is variable drought impacts across different users and districts: some experience very severe shortages, while others are largely unaffected. This highlights that the scenario storylines most relevant to different stakeholders' interests might vary and that planning efforts should be broad in how they select scenarios to prepare for the future.
Explore Storylines
Select a storyline to see examples of real world impact:

Broader Implications and Future Directions
FRNSIC addresses a gap between the rigor of exploratory modeling and the usability of traditional narrative scenarios. It enables narrative scenario discovery for multiple states and multiple impacts and can illuminate critical dynamic pathways that lead to consequential outcomes. The narrative drought storylines produced by FRNSIC can be utilized in future work in the basin, for example, to examine how drought events change when we decide to adapt in a certain direction. This opens doors for policy makers as it allows them to explore different states the world could be in, and helps review how different interventions might affect the basin under each storyline. These drought scenarios can be used to illuminate potential consequences, and therefore be used in planning by local decision makers.
The possibilities for FRNSIC go beyond the Colorado River Basin and can be applied to other areas, especially where critical resources are threatened by climate change. FRNSIC can be used to generate a clearer understanding of the complex dynamics at play within the system, enabling decision makers to make more informed decisions about the diverse impacts to their stakeholders, as well as anticipate the critical system conditions that produce them.